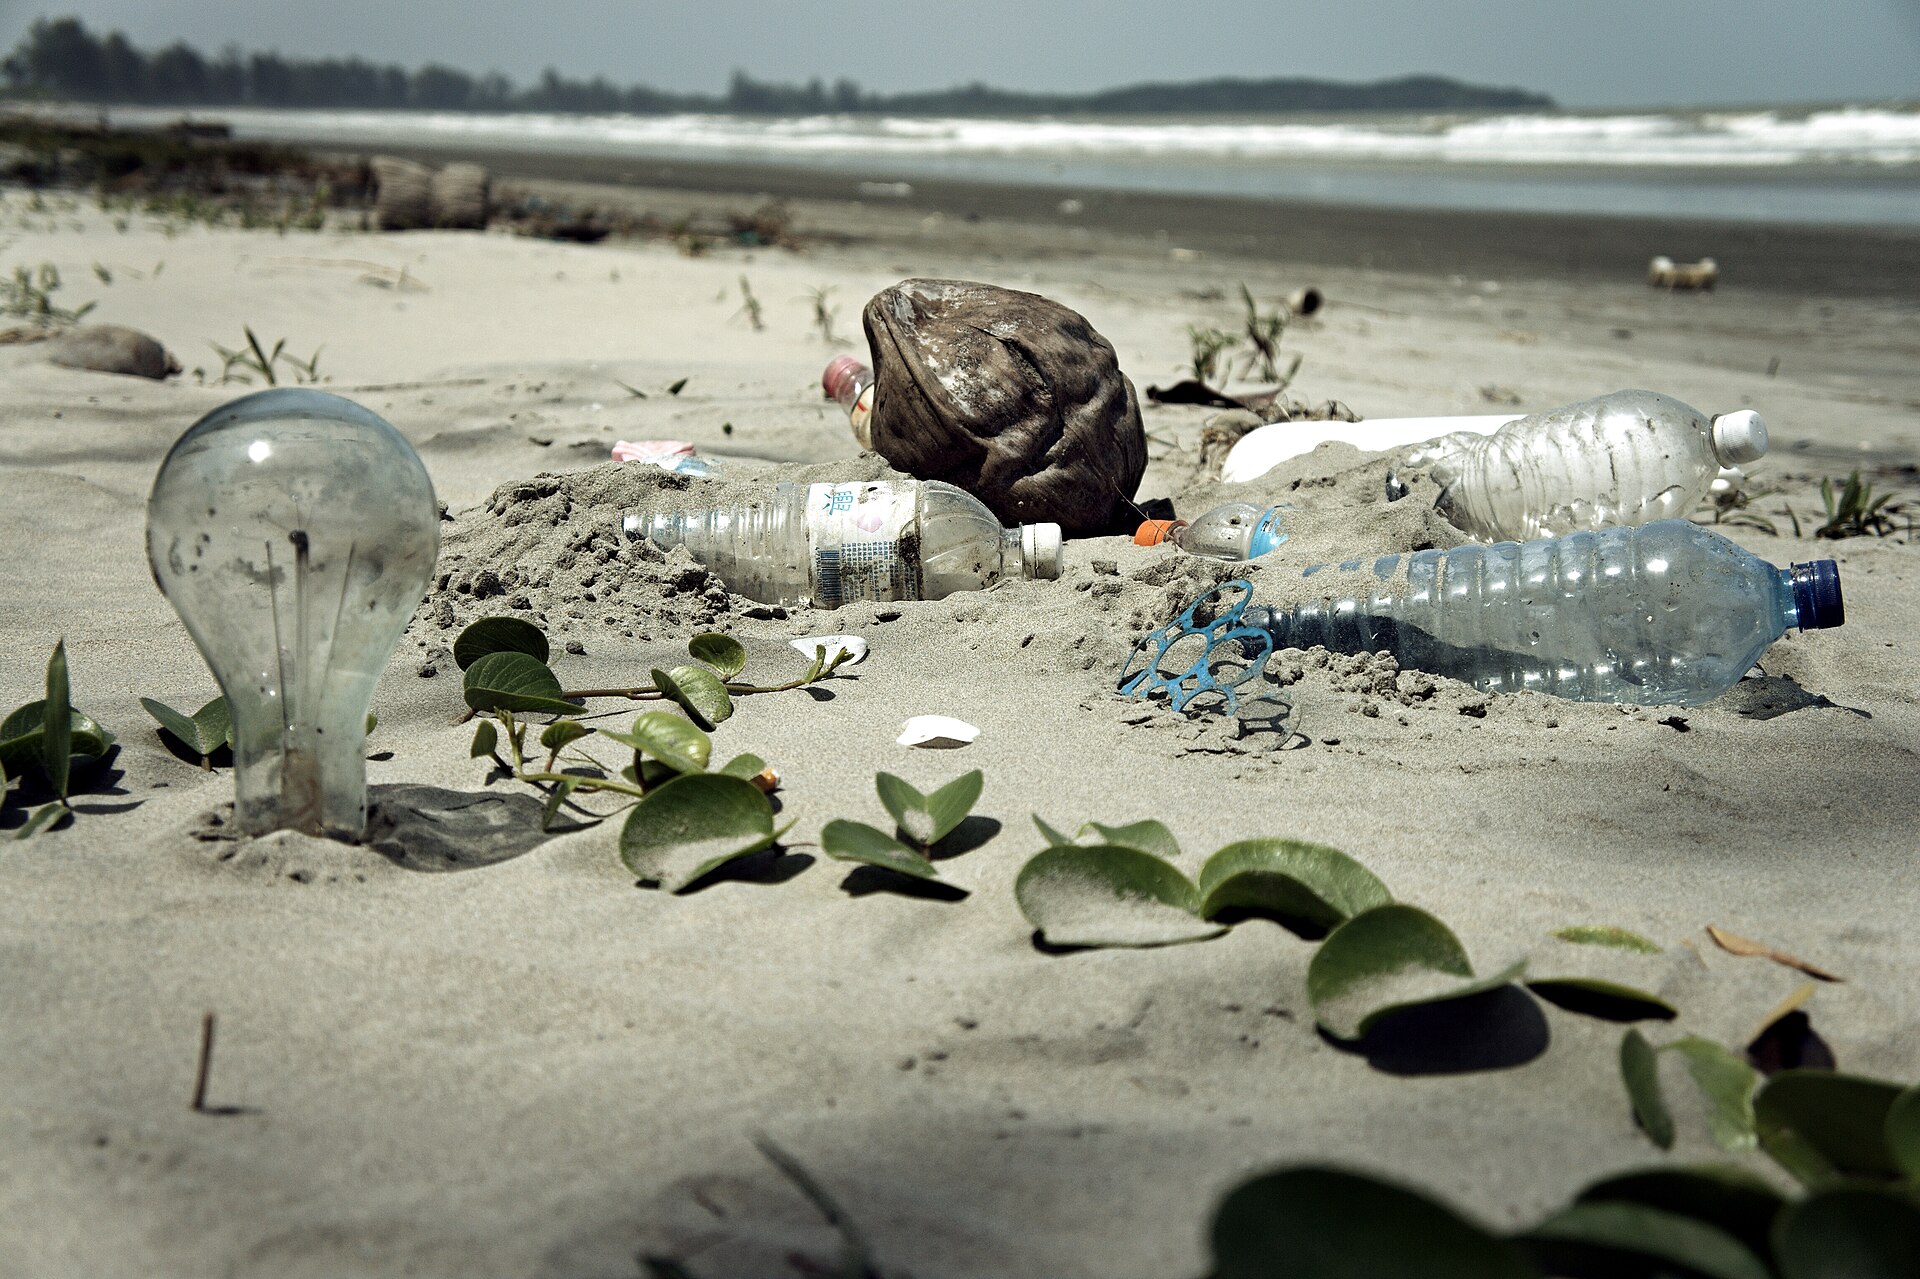
A visitor sees drinks served in plastic, bags in a market and litter beside a road. The criticism may describe something real. But it can still tell an incomplete story. Pollution is not only what lies visibly on a beach. It is also the fuel burned for frequent flights, the minerals inside a new phone, the carbon embodied in imported goods, the packaging designed by global brands and the waste shipped elsewhere. Once those hidden flows are counted, affluent lifestyles usually carry the larger footprint.
THE SHORT ANSWER
Who pollutes most depends on what we count
- Consumption and resources
- High-income countries consume about six times more materials per person and cause more than ten times the climate impacts of low-income countries. UNEP–IRP, 2024.
- Plastic waste
- OECD economies generated almost half of global plastic waste in 2019. The United States alone accounted for 21%. OECD, 2022.
- Visible leakage
- Indonesia faces exceptionally high mismanagement and marine leakage because collection and treatment have not kept pace with consumption, geography and urban growth. World Bank, 2021; OECD, 2025.
- Before it becomes waste
- The world produced 436 million tonnes of plastic in 2023. More than 78% was traded internationally in primary, intermediate or embedded forms. UNCTAD, 2025.
FIRST: REFUSE THE FALSE LEADERBOARD
There is no single “most polluting country”
A country can rank high on one measure and lower on another. Total emissions reflect population and industry. Per-person figures reveal lifestyle intensity. Territorial accounts assign pollution to the place of production; consumption accounts follow the final buyer. Waste generation measures what is discarded; leakage measures what escapes collection. Historical emissions show who used the atmospheric space over time.
In 2019, the United States produced 21% of the global total and China 19%. Per person, the United States generated about 221 kg, OECD Europe 114 kg, China 47 kg and India 14 kg (OECD, 2022).
High-income countries use roughly six times more materials per person than low-income countries. Their food, mobility, housing and energy systems cause more than ten times the climate impacts per person (UNEP–IRP, 2024).
Six major emitters produced 63% of global GHG emissions in 2023. US and Russian per-person emissions were close to three times the world average; least developed countries contributed only 3% in total (UNEP, 2024).
Europe generated the most e-waste per person in 2022—17.6 kg—although it also documented the highest regional collection and recycling rate (ITU/UNITAR, 2024).
Leakage is concentrated where collection, safe disposal and financing are weakest. That is a failure of infrastructure and product systems, not proof that residents consume the most.
WHY IT LOOKS DIFFERENT HERE
Indonesia and Malaysia carry a highly visible burden
Archipelagic geography, intense rainfall, long coastlines and rivers make escaped waste mobile and conspicuous. Collection is harder across islands, remote settlements and fast-growing cities. The World Bank estimated that Indonesia generated about 7.8 million tonnes of plastic waste annually in its national model; 4.9 million tonnes were mismanaged and roughly 346,500 tonnes reached the marine environment from land each year. Uncollected waste—not leakage from well-managed facilities—was the larger pathway (World Bank, 2021).
Newer Indonesian administrative data show both progress and the scale of the unfinished work. For 2024, 317 reporting districts and cities recorded 34.2 million tonnes of total waste; 40.26% was classified as unmanaged. This is not a complete national census, so the reporting coverage belongs beside the number (Indonesia SIPSN, 2024 data).
Malaysia’s official environmental statistics reported plastic at 26.9% of solid waste composition in 2023. Yet Malaysia is not merely a passive consumer: plastics manufacturing contributed an estimated US$7.23 billion, or 4.7% of GDP, in 2018. The World Bank found that only 24% of four key resins was recycled in 2019, while cheap virgin resin, weak demand for recycled content and products not designed for recycling undermined circularity (DOSM, 2026 compendium; World Bank, 2021).
WHY PLASTIC BECAME EVERYDAY
Convenience is only part of the explanation
Low unit price
Small packets make food, detergent and personal-care products affordable one purchase at a time, even when they cost more per gram.
Heat, moisture and distance
Light, sealed packaging protects goods through tropical humidity, informal retail and long island supply chains.
Public health
Single-use formats can provide hygiene and safe storage where water, refill and cold-chain systems are uneven.
Corporate design
Manufacturers choose materials, formats and additives long before a consumer reaches the shelf.
Missing alternatives
Refill works only when containers, logistics, standards and convenient return points exist.
Unequal economics
Virgin plastic can be cheaper than recycled resin while collection costs fall on municipalities and communities.
This history is modern, not cultural destiny. Traditional markets used leaves, baskets, glass, paper and reusable containers. Plastic expanded with petrochemicals, mass retail, branded consumer goods and disposable delivery systems. UNEP therefore argues for reduction, reuse, redesigned products, recycled materials and producer responsibility—not recycling alone (UNEP, 2023).
BEFORE THE STREET: FOLLOW THE SUPPLY
Plastic pollution begins before anyone throws anything away
There is no single producing country to blame. The chain begins with oil and gas feedstocks, continues through petrochemical and resin producers, converters and packaging manufacturers, and reaches brands and retailers that decide what is sold and in what format. UNCTAD counted 436 million tonnes of global plastic production in 2023 and US$1.13 trillion in plastics trade. More than 78% of production crossed borders in primary, intermediate or embedded forms (UNCTAD, 2025).
That changes the question. A municipality may collect the wrapper, but it did not choose the polymer, the sachet or the absence of a refill system. Responsibility must therefore follow both demand and decision-making power: reduce virgin production, redesign products, require reuse where it works and make producers finance collection and end-of-life costs. UNEP calls for this kind of system change—not simply a better litter campaign (UNEP, 2023).
The person holding the package is the last link in the chain—not the only author of it.
THE POLLUTION THAT CROSSES A BORDER
Affluent consumption does not end at the bin
Production-based statistics can make a wealthy importing country appear cleaner because emissions, mining damage, water use and factory waste are registered where goods are made. Consumption-based accounting reconnects some of those impacts to the final demand that caused them. The same principle applies to waste exports.
OECD monitoring found that Malaysia received 0.61 million tonnes of reported plastic waste and scrap in 2023, making it the largest destination globally. Indonesia received 0.27 million tonnes. OECD exports to non-OECD countries rose 15% between 2022 and 2023; Japan, the Netherlands, Germany, Spain, the United Kingdom and United States were the largest OECD exporters to non-members. Traded material can be legitimate recycling feedstock, but OECD data also show exports to non-members had slightly lower value per kilogram, which may indicate lower quality (OECD, 2025).
The wider trend is not simply “more waste trade”. Reported global exports fell from 15.58 million tonnes in 2014 to 6.04 million in 2023, while China’s restrictions redirected part of the remaining flow. The OECD now warns that low-quality material can be dumped in lower- and middle-income destinations when environmentally sound processing capacity is insufficient (OECD, 2025).
“For recycling” is a claim with conditions
Under the Basel Convention, plastic waste can move outside its prior-informed-consent procedure only in narrow cases: qualifying polymers must be destined for environmentally sound recycling and be almost free from contamination and other waste. Mixed or contaminated loads are controlled, and hazardous plastic waste falls under stricter rules. In other words, a customs label does not settle the practical question; composition, contamination and the receiving facility still matter (Basel Convention Secretariat).
Malaysia tightened its own gatekeeping from 1 July 2025: SIRIM became the sole inspection body and issuer of Certificates of Approval for waste-plastic imports, and eligible exporters must come from countries that have signed and ratified the Basel Convention. The Malaysian Department of Environment’s application checklist requires laboratory analysis, contaminant percentages, the proposed recovery process, the residue it will generate and how that residue will be disposed of, plus a pre-loading inspection report (MITI, 2025; Malaysia DOE).
A clean street in a wealthy country may reflect excellent collection. It may also sit at the end of a supply chain whose extraction, manufacturing and disposal happened somewhere else. Both facts can be true.
WHO PAYS THE CONSEQUENCES?
The footprint and the harm rarely belong to the same people
Those closest to leakage
- Coastal and river communities lose fisheries, amenity and tourism income.
- Residents near dumps, burning and processing sites face smoke, odour and contaminated water.
- Municipalities pay to collect products they did not design.
- Informal waste workers recover valuable material while carrying physical and market risks.
Those driving demand
- Higher-income households consume more mobility, floor space, energy, electronics and short-lived goods.
- Brands decide packaging systems and where producer responsibility applies.
- Retail and delivery models reward speed, small portions and disposability.
- Importing economies receive goods while many production impacts remain abroad.
The World Bank’s latest global waste assessment counts an estimated 18 million urban waste workers, with collection, sorting and recycling jobs concentrated in lower-income countries. It also estimates that low- and lower-middle-income countries need US$556 billion in waste-sector investment between 2022 and 2050 (World Bank, What a Waste 3.0).
WHO IS BEHIND THE DISCOURSE?
There is no single voice—and no innocent viewpoint
There is no official dataset measuring how often foreigners complain about plastic in Indonesia or Malaysia. Treating “foreigners” as one coordinated group would repeat the simplification this story is questioning. The discourse is produced by overlapping actors:
Travellers and expatriates
They compare visible streets with the managed surfaces of home, often without comparing their flights, consumption or outsourced production.
Local communities and activists
They have long challenged dumping, burning, floods and weak enforcement. Environmental concern is not a foreign invention.
Governments and cities
“Cleanliness” campaigns can mobilise action, but may overemphasise behaviour while underfunding collection and producer rules.
Brands and industry
Voluntary clean-ups and recyclable labels can help, yet become greenwashing when absolute virgin-material use and financing remain untouched.
Media and tourism
A littered beach is an immediate image. A material footprint or imported tonne of carbon is harder to photograph.
International institutions
UN, OECD and World Bank evidence increasingly moves from blaming consumers toward full-life-cycle policy, infrastructure and producer responsibility.
A GREENWASHING TEST
Five questions before accepting the clean story
A recyclable wrapper still becomes waste, and “recyclable” does not mean it is actually collected or recycled locally.
Territorial statistics alone can hide pollution embodied in imported goods.
Responsibility should not stop with the person holding the package.
A circular economy that depends on unsafe, underpaid labour is not fully just.
Communities living with pollution should shape the diagnosis, priorities and benefits.
THE BETTER CONVERSATION
Notice the litter. Bring your footprint into the picture.
Indonesia and Malaysia must strengthen collection, stop open dumping and burning, regulate imports, build reuse systems and make producers finance what they place on the market. Visible pollution is real, and relativising it away would abandon the people living beside it.
But criticism from affluent societies becomes credible only when it also confronts high-consumption lifestyles, fossil-fuel and petrochemical production, corporate product design, imported emissions and exported waste. The aim is not to decide which country deserves shame. It is to put responsibility wherever power, profit and consumption actually sit.
Do not look away from the plastic on the beach. Look upstream—and do not stop at the national border.
REFERENCES
Official data and further reading
- Basel Convention Secretariat. Plastic Waste Amendments: FAQs.
- Department of Statistics Malaysia. (2026). Compendium of Environment Statistics Malaysia, solid-waste composition table for 2019–2023.
- International Telecommunication Union & UNITAR. (2024). Global E-waste Monitor 2024.
- Indonesia Ministry of Environment and Forestry. (2025 portal). SIPSN: 2024 municipal waste-management reporting.
- Malaysia Department of Environment. Checklist for the Plastic Waste Import Application.
- Malaysia Ministry of Investment, Trade and Industry. (2025). Malaysia adheres to Basel Convention for plastic-waste imports.
- OECD. (2022). Global Plastics Outlook.
- OECD. (2025a). Regional Plastics Outlook for Southeast and East Asia.
- OECD. (2025b). Monitoring trade in plastic waste and scrap 2025.
- OECD. (2025c). Why is the OECD monitoring trade in plastic waste and scrap?.
- UN Trade and Development. (2025). Global Trade Update: Mobilising trade to curb plastic pollution.
- UNEP. (2023). Turning off the Tap.
- UNEP International Resource Panel. (2024). Global Resources Outlook 2024.
- UNEP. (2024). Emissions Gap Report 2024.
- World Bank. (2021a). Plastic Waste Discharges from Rivers and Coastlines in Indonesia.
- World Bank. (2021b). Market Study for Malaysia: Plastics Circularity Opportunities and Barriers.
- World Bank. (2026). What a Waste 3.0.
Sources reviewed 26 August 2026. “Latest” refers to the latest official release found for each comparable indicator; underlying data years differ and are stated in the article. Trade data cover reported HS 3915 plastic waste and scrap, not every plastic embedded in other goods.
Researched and written by Julieta Castiñeira de Dios.